Wednesday, 28 October 2015
Take-home lessons and code from a factor-cluster analysis with imputation
Recently I was tapped to examine data from a survey of ~200 children to find if their learning preferences fell into well-defined profiles (i.e. clusters). The relevant part of the survey had more than 50 Likert scale questions The client and I had decided that a factor analysis, followed by a cluster analysis would be most appropriate.
I learned some things in doing this analysis, and wanted to share that and some relevant code.

Sunday, 18 October 2015
Teaching Philosophy Statement on Intro Math/Stats - Cartographers of Knowledge
In the digital age, a teacher's role is not simply to present knowledge, but to navigate it. The overwhelming majority of the information that an undergraduate gains in her degree is available for free on the internet or in libraries.
A digital age instructor's job is to guide and motivate students' paths through this information – to provide the vision and context necessary to develop expertise in a field. Introductory courses make up the bulk of students' collective experience with mathematics and statistics, so any expertise to be gained in those one or two courses needs to be a self-contained package.
For example, rigorous proofs serve introductory students very little; the practice of rigor and constructing proofs has little value until upper-division courses. Introductory students learn by doing the tasks that are actually relevant to the course: examples. As such, I prefer to relegate much of the proof work to optional out-of-class readings. The extra instructional time for guided, step-by-step examples makes the material more accessible. It also provides more opportunities to fill the fundamental gaps from high school mathematics that will otherwise prevent understanding. For the few that do continue in a mathematics or statistics major, I feel that what they may lack in experience with proofs is more than compensated by a stronger foundation in the introductory material.
This focus on accessibility extends to my policies on assignments and office hours. Assignments should be vehicles for students to struggle through a set of practice problems and receive formative feedback. However, logistics of providing quality feedback aside, that doesn't work for everyone. Assignments need to have grades attached so students will have extrinsic motivation to completing them, but these same grades penalize mistakes on something that should be practice.
I want assignments to be important and challenging enough to take seriously, but not so much as to tempt plagiarism. In the past, I have solved this by booking extra office hours on the days before assignments are due, and telling my students that I will give them entire solutions to assignment questions. I've found that on these office days, a group of 5-12 students would come to my office with their assignment hang-ups, but that they could answer each others' questions with only moderate guidance from me. Some of these students likely sat in to get their solutions from the rest of the office group, but that's still better than copying written assignments verbatim.
Finally, I try to explicitly declare the 'take-home messages' by including them in my lessons. That is, the few ideas that I hope students will remember long after the final exam is over. These messages include general strategies about the mathematical sciences such as “every hard problem is merely a collection of easy problems”, and George Box's quote “all models are wrong, some are useful.”. If my students are to retain anything from their time spent on coursework, I hope it's something of value and general applicability rather than memories of referring to tables of integrals and probability.
A digital age instructor's job is to guide and motivate students' paths through this information – to provide the vision and context necessary to develop expertise in a field. Introductory courses make up the bulk of students' collective experience with mathematics and statistics, so any expertise to be gained in those one or two courses needs to be a self-contained package.
For example, rigorous proofs serve introductory students very little; the practice of rigor and constructing proofs has little value until upper-division courses. Introductory students learn by doing the tasks that are actually relevant to the course: examples. As such, I prefer to relegate much of the proof work to optional out-of-class readings. The extra instructional time for guided, step-by-step examples makes the material more accessible. It also provides more opportunities to fill the fundamental gaps from high school mathematics that will otherwise prevent understanding. For the few that do continue in a mathematics or statistics major, I feel that what they may lack in experience with proofs is more than compensated by a stronger foundation in the introductory material.
This focus on accessibility extends to my policies on assignments and office hours. Assignments should be vehicles for students to struggle through a set of practice problems and receive formative feedback. However, logistics of providing quality feedback aside, that doesn't work for everyone. Assignments need to have grades attached so students will have extrinsic motivation to completing them, but these same grades penalize mistakes on something that should be practice.
I want assignments to be important and challenging enough to take seriously, but not so much as to tempt plagiarism. In the past, I have solved this by booking extra office hours on the days before assignments are due, and telling my students that I will give them entire solutions to assignment questions. I've found that on these office days, a group of 5-12 students would come to my office with their assignment hang-ups, but that they could answer each others' questions with only moderate guidance from me. Some of these students likely sat in to get their solutions from the rest of the office group, but that's still better than copying written assignments verbatim.
Finally, I try to explicitly declare the 'take-home messages' by including them in my lessons. That is, the few ideas that I hope students will remember long after the final exam is over. These messages include general strategies about the mathematical sciences such as “every hard problem is merely a collection of easy problems”, and George Box's quote “all models are wrong, some are useful.”. If my students are to retain anything from their time spent on coursework, I hope it's something of value and general applicability rather than memories of referring to tables of integrals and probability.
Monday, 12 October 2015
Now you're thinking with gates!
What do Nintendo and Bitcoin enthusiasts have in common? They weren't content with solving their problems through software advancements alone. The statistical computing field shouldn't be either.
-------------------
The Super Nintendo Entertainment System is a cartridge-based system, meaning that its games were stored on circuit boards encased in plastic cartridges. Unlike disc-based media of most later generations of game consoles, the contents of cartridges were not restricted to read-only data. The most common addition to game cartridges was a small cache of re-writable memory used to store progress data in the cartridge.
Originally, active objects in games, called sprites, could only be displayed as one of a set of pre-drawn frames. That's why sprite animations are usually simple loops of a few frames, and why characters are rarely seen changing size as they move towards or away from the player's point of view.
However, later games also included special-purpose microchips that expanded the graphical capabilities of the Super Nintendo console itself. One of these chips allowed the SNES to change the way sprites look as the game was happening, which made sprites look much more alive. This chip also allowed for rudimentary three-dimensional rendering.
Any software workaround to get these effects using only the hardware given in the Super Nintendo would have taking much longer and produced much worse results, if any at all. The video on the Super Nintendo (SNES) by video game trivia group Did You Know Gaming covers these effects and the chips in more detail, and shows some great demonstrations.
------------------
Bitcoin, is a cryptocurrency. Part of what gives it value is the premise that it is computationally hard to create or 'mine' for new ones. In fact, there is a self-adjustment mechanism that increases the mining difficulty in proportion to the total computing power of all miners.
I've appended this historical chart of the log of the total computer power (and the log difficulty), over time with the two hardware advancements that defined the trend in bitcoin mining power.

-------------------
The Super Nintendo Entertainment System is a cartridge-based system, meaning that its games were stored on circuit boards encased in plastic cartridges. Unlike disc-based media of most later generations of game consoles, the contents of cartridges were not restricted to read-only data. The most common addition to game cartridges was a small cache of re-writable memory used to store progress data in the cartridge.
Originally, active objects in games, called sprites, could only be displayed as one of a set of pre-drawn frames. That's why sprite animations are usually simple loops of a few frames, and why characters are rarely seen changing size as they move towards or away from the player's point of view.
However, later games also included special-purpose microchips that expanded the graphical capabilities of the Super Nintendo console itself. One of these chips allowed the SNES to change the way sprites look as the game was happening, which made sprites look much more alive. This chip also allowed for rudimentary three-dimensional rendering.
Any software workaround to get these effects using only the hardware given in the Super Nintendo would have taking much longer and produced much worse results, if any at all. The video on the Super Nintendo (SNES) by video game trivia group Did You Know Gaming covers these effects and the chips in more detail, and shows some great demonstrations.
------------------
Bitcoin, is a cryptocurrency. Part of what gives it value is the premise that it is computationally hard to create or 'mine' for new ones. In fact, there is a self-adjustment mechanism that increases the mining difficulty in proportion to the total computing power of all miners.
I've appended this historical chart of the log of the total computer power (and the log difficulty), over time with the two hardware advancements that defined the trend in bitcoin mining power.
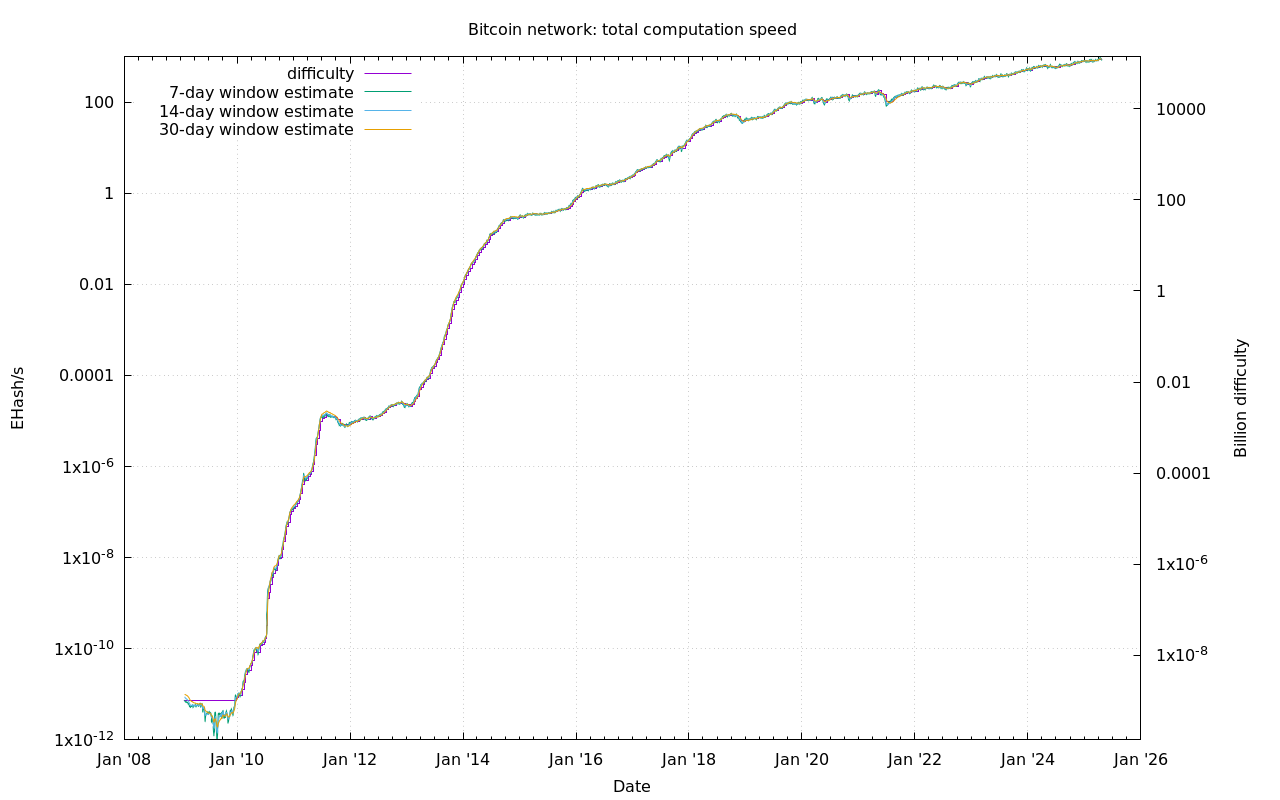

The first event represents the first time mining using a more specialized graphical processing unit (GPU) rather than a more general central processing unit (CPU) was made publicly possible. Since many miners had compatible graphics cards already, we see a tenfold jump in power almost instantly.
The second event represents the first time mining using a single-purpose processor, called an ASIC* was introduced to the market. This time, another rapid increase in processing power is sparked, but without the initial leap.
An ASIC is orders of magnitude faster at the simple, repetitive task of mining bitcoins than a GPU is, and a GPU mines orders of magnitude faster than a comparably priced CPU. In both cases, the new hardware quickly rendered any previous mining methods obsolete.
* Application Specific Integrated Circuit.
---------------
When developing new methods to solve computational problems, a software approach usually works best. The results of purely software-based are often portable as packaged programs, and the dissemination of improvements can be as quick and as cheap as a software update. The feedback loop of testing and improvement is very quick, and there are many languages such as the R, SAS, and Julia that can make software-based solutions a routine task.
Making hardware to solve a problem may sound insane by comparison - why would anyone willingly give up all of those advantages? This is where Field Programmable Gate Arrays come in. An FPGA is essentially a circuit board that can be programmed down to the gate level. That is, a user can write a program in terms of the fundamental particles of computation, OR, NOT, XOR, AND, and NAND gates.
The FPGA takes a set of gate instructions and physically wires itself into the programmed configuration. When set, the FPGA is essentially an ASIC, an processor that can only do one task but potentially much faster than a general purpose computer. However, if needed, an FPGA can be re-programmed, so the advantage of a quick trial-and-error turnaround is there. Also, the program can be disseminated like any other software. The most popular FPGAs cost between $200 and $500 USD.
The bitcoin ASIC started off as an FPGA. Once the FPGA program was made, it took about a year for the first ASICs to be sold. This is encouraging for anyone looking towards FPGAs for the next great leap in statistical computing, as it means the endeavor has commercial viability. Just think how much faster some common methods could become even if only large matrix inversion was made faster.
It's time to start thinking with gates.
Tuesday, 8 September 2015
Arguments for Journals of Replication
In today's xkcd, a collection of hypothetical headlines are given, all of which would spell trouble for science as a whole. Also, these headlines all have to do with replicating experiments. The only fictional part of (most of) these headlines is that they're showing up in the news, because this is an old problem. Given that new journals are frequently being made as fields evolve and grow, it's surprising to not find any journals of replication and verification, because having such journals could help make science more honest.
Creating and contributing to journals dedicated to replicating, verifying, and assessing work in a field is a worthwhile endeavour. Here's why:
Primary Motivation - Having a journal of replication in a field would implicitly improve the quality of research across that field. It would do this by effectively putting a bounty on bad research by offering a publication opportunity for addressing flaws. It also provides an incentive for a team that 'gets there second' to publish, which could remove some of the unscientific competitiveness of people working towards the same goal. Finally, it provides relatively easy publication opportunities for people wishing to do the work that makes a field's body of work more cohesive by repeating key experiments or by conducting meta-studies.
Assertion 1 - Replication has high scientific value: Consider an experiment done twice, in two independent labs. It may not produce as much new information as two different experiments, but the information it does provide would be of a higher quality. That's what scientific journals are supposed to do - focus on quality. Large volumes of low quality information can be found anywhere.
Assertion 2 - Replication is easy and safe: Assuming that the method have been outlined well, someone trying to replicate an experiment can skip past a lot of the planning and false starts of the original researcher. The second research team even has the first one to ask questions. It's safe in that the chance of a new discovery, and hence publication delays, is low. This makes it suitable for the sort of mass produced work that can be outsourced to graduate students with minimal degree hiccups.
Assertion 3 - A replication journal has reward potential for contributors: Logically, most replication papers fall into two categories: Refutation or verification. If research is verified, the original researchers gain prestige and a citation, and the replicators gain a publication. In future work, many groups mentioning the original work will want to cite both papers because together they make a stronger argument. If the research if refuted, at best it could spark interest in 'tiebreaker' work by a 3rd research party, which would cite both (positively, if everything was done honestly), and at worst the original work dies early where it would or should have anyway, and the replicators establish their reputation for rigor.
Assertion 4 - A replication journal has reader appeal: If someone is reading a research paper, they may be interested how credible the work is after it has been subject to public scrutiny. A replication journal appropriate to the paper's field would be a good first place to look because it would save the reader the trouble of filtering through work that cited the paper in question or looking for otherwise related work that may lend to or take credence from the paper. In short, a replication journal would offer the same service to readers that review sites offer to consumers of more commercial goods.
Assertion 5 - A replication journal would be easy to administer: Aside from papers on related verification methods, all the relevant submissions to such a journal would be adhere to specific formulae - they would either be direct replications or metastudies. Hopefully, this would make the editing and review work of these papers easier because most viable papers would look the same: Introduction of the work to be replicated, comparison of methods, comparison of results, short discussion. Criteria for publication would have few ambiguities that require editorial decision-making.
Creating and contributing to journals dedicated to replicating, verifying, and assessing work in a field is a worthwhile endeavour. Here's why:
Primary Motivation - Having a journal of replication in a field would implicitly improve the quality of research across that field. It would do this by effectively putting a bounty on bad research by offering a publication opportunity for addressing flaws. It also provides an incentive for a team that 'gets there second' to publish, which could remove some of the unscientific competitiveness of people working towards the same goal. Finally, it provides relatively easy publication opportunities for people wishing to do the work that makes a field's body of work more cohesive by repeating key experiments or by conducting meta-studies.
Assertion 1 - Replication has high scientific value: Consider an experiment done twice, in two independent labs. It may not produce as much new information as two different experiments, but the information it does provide would be of a higher quality. That's what scientific journals are supposed to do - focus on quality. Large volumes of low quality information can be found anywhere.
Assertion 2 - Replication is easy and safe: Assuming that the method have been outlined well, someone trying to replicate an experiment can skip past a lot of the planning and false starts of the original researcher. The second research team even has the first one to ask questions. It's safe in that the chance of a new discovery, and hence publication delays, is low. This makes it suitable for the sort of mass produced work that can be outsourced to graduate students with minimal degree hiccups.
Assertion 3 - A replication journal has reward potential for contributors: Logically, most replication papers fall into two categories: Refutation or verification. If research is verified, the original researchers gain prestige and a citation, and the replicators gain a publication. In future work, many groups mentioning the original work will want to cite both papers because together they make a stronger argument. If the research if refuted, at best it could spark interest in 'tiebreaker' work by a 3rd research party, which would cite both (positively, if everything was done honestly), and at worst the original work dies early where it would or should have anyway, and the replicators establish their reputation for rigor.
Assertion 4 - A replication journal has reader appeal: If someone is reading a research paper, they may be interested how credible the work is after it has been subject to public scrutiny. A replication journal appropriate to the paper's field would be a good first place to look because it would save the reader the trouble of filtering through work that cited the paper in question or looking for otherwise related work that may lend to or take credence from the paper. In short, a replication journal would offer the same service to readers that review sites offer to consumers of more commercial goods.
Assertion 5 - A replication journal would be easy to administer: Aside from papers on related verification methods, all the relevant submissions to such a journal would be adhere to specific formulae - they would either be direct replications or metastudies. Hopefully, this would make the editing and review work of these papers easier because most viable papers would look the same: Introduction of the work to be replicated, comparison of methods, comparison of results, short discussion. Criteria for publication would have few ambiguities that require editorial decision-making.
Tuesday, 4 August 2015
Lesson Prototype - First Lecture on Multiple Imputation
Continuing the work on my data management course, here's the start of the Imputation unit. I'm intending three units in total - Text processing, principles of data manipulation (cleaning, merging, formatting, and database access), and imputation.
Friday, 31 July 2015
Possible Application of Approximate Bayesian Computation for Networks
I've been thinking about possible applications for the network simulation/analysis program that Steve Thompson and I developed as part of my PhD thesis.*
I propose to investigate the effect of response order/timing in respondent-driven sampling on estimates of network parameters.
Here I'm assuming that samples are taken in waves. That is, a collection of seed members of the population are identified and given the initial coupons. If the standard deviation of the response times is small compared to the mean, the network of the population is being sampled in a manner similar to breadth first search (BFS). If the standard deviation of response times is large relative the mean, the network ends up being sampled in a manner closer to that of a depth first search (DFS). Each of these sampling methods has the potential to provide vastly different information about the sample.
Such an investigation would include four parts:
1) Motivating questions: Why would we care about the time it takes members of the population to be entered into the sample? Because perhaps these times could be influenced by different incentive structures. If they can, what is best? If they cannot, we can do a what-if analysis to explore counter-factuals. Does timing matter? What sampling and incentive setups are robust to the effects of response times? Are there statistical methods that can adjust for the effects of response times?
2) Find some real respondent-driven samples, preferably by looking in the literature of PLoS-One and using the data that is included with publications, but possibly by asking other researchers individually.
Look at the time stamp of each observation in each data set, if available, and fit a distribution such as gamma(r, beta) to the time delay between giving a recruitment coupon and that recruitment coupon being used. Compare the parameter estimates that each data set produces to see if there is a significant difference between them and see if there's any obvious reason or pattern behind the changes.
3) Generate a few networked populations and sample from each one many times using the different response-delay time distributions found in Part 2. Are there any significant changes to the network statistics that we can compute from the samples we find? That is, how does the variation of the statistics between resamples under one delay time distribution compare to the variation between delay time distributions?
4) Employ the full ABCN system to get estimates of whatever network parameters we can get for case ij, 1 <= i,j <= M, where M is the number of datasets we find. Case ij would be using the observed sample from the ith dataset, with simulations in the ABCN system using the delay distribution estimated from the jth dataset.
This way, we could compare the variation in the network parameters attributable to the sample that was actually found, and how much was attributable to the difference in time it took for recruitments to be entered into the survey. Also, we effectively will have performed a what-if analysis on the datasets we use - and seeing if the conclusions from the datasets would have been different if the recruited respondents had been responded with different delay structures.
---------------------------------------
*This network simulation/analysis system takes an observed sample of network and computes a battery of summarizing statistics of the sample. Then it simulates and samples from many networks and computes the same battery from each sample. It estimates the parameters of the original sample by looking at the distribution of parameters from the simulation samples that were found to be similar to the observed sample.
This will all be explained again, and in greater detail when I post my thesis after the defense in... gosh.. a month. Basically it's statistical inference turned upside down, where you generate the parameters and see if they make the sample you want, instead of starting with the sample and estimating a parameter value or distribution. The base method is called Approximate Bayesian Computation.
I propose to investigate the effect of response order/timing in respondent-driven sampling on estimates of network parameters.
Here I'm assuming that samples are taken in waves. That is, a collection of seed members of the population are identified and given the initial coupons. If the standard deviation of the response times is small compared to the mean, the network of the population is being sampled in a manner similar to breadth first search (BFS). If the standard deviation of response times is large relative the mean, the network ends up being sampled in a manner closer to that of a depth first search (DFS). Each of these sampling methods has the potential to provide vastly different information about the sample.
Such an investigation would include four parts:
1) Motivating questions: Why would we care about the time it takes members of the population to be entered into the sample? Because perhaps these times could be influenced by different incentive structures. If they can, what is best? If they cannot, we can do a what-if analysis to explore counter-factuals. Does timing matter? What sampling and incentive setups are robust to the effects of response times? Are there statistical methods that can adjust for the effects of response times?
2) Find some real respondent-driven samples, preferably by looking in the literature of PLoS-One and using the data that is included with publications, but possibly by asking other researchers individually.
Look at the time stamp of each observation in each data set, if available, and fit a distribution such as gamma(r, beta) to the time delay between giving a recruitment coupon and that recruitment coupon being used. Compare the parameter estimates that each data set produces to see if there is a significant difference between them and see if there's any obvious reason or pattern behind the changes.
3) Generate a few networked populations and sample from each one many times using the different response-delay time distributions found in Part 2. Are there any significant changes to the network statistics that we can compute from the samples we find? That is, how does the variation of the statistics between resamples under one delay time distribution compare to the variation between delay time distributions?
4) Employ the full ABCN system to get estimates of whatever network parameters we can get for case ij, 1 <= i,j <= M, where M is the number of datasets we find. Case ij would be using the observed sample from the ith dataset, with simulations in the ABCN system using the delay distribution estimated from the jth dataset.
This way, we could compare the variation in the network parameters attributable to the sample that was actually found, and how much was attributable to the difference in time it took for recruitments to be entered into the survey. Also, we effectively will have performed a what-if analysis on the datasets we use - and seeing if the conclusions from the datasets would have been different if the recruited respondents had been responded with different delay structures.
---------------------------------------
*This network simulation/analysis system takes an observed sample of network and computes a battery of summarizing statistics of the sample. Then it simulates and samples from many networks and computes the same battery from each sample. It estimates the parameters of the original sample by looking at the distribution of parameters from the simulation samples that were found to be similar to the observed sample.
This will all be explained again, and in greater detail when I post my thesis after the defense in... gosh.. a month. Basically it's statistical inference turned upside down, where you generate the parameters and see if they make the sample you want, instead of starting with the sample and estimating a parameter value or distribution. The base method is called Approximate Bayesian Computation.
Sunday, 26 July 2015
Prediction Assisted Streaming
The online game path of exile has a trick for reconciling a game that requires quick reaction times with the limitations of servers: it predicts the actions of the players. It doesn't have to predict far ahead - a couple hundred milliseconds - to keep the action running smoothly most of the time.
Prediction on this time frame isn't hard in principle; play often involves performing the same short
action repeatedly, such as firing an arrow, so the default prediction is just more of that. When the server predicts incorrectly, it usually has enough time to 'rewind' to the present and handle things as they come. The prediction is just an extra buffering layer that's in place when there is a lot of server lag.
Does video or music streaming do this? Could it?
In a song with a repetitive baseline, could the information to the client computer include: "repeat the sound from time x with the following deviations included in the buffer", rather than "play the following sound"? The "sound at time x" in this case is a note from the baseline and the deviations being the result of a human playing an instrument and not hitting the note exactly the same every time. In a case like that, potentially less data would need to be sent to reproduce the song, allowing for longer buffers or higher sound quality.
Likewise for video. Consider a live video feed of a soccer match, in which a player is running across the field. Video prediction may determine there is an object moving at some speed in some direction and predict a few frames ahead where that object will be, and thus what pixels to draw in that spot. Then the streaming service, making the same prediction, could just send the video information that deviates from this prediction.
For repetitive patterns like an animation of a like a spinning wheel or sparkling logo of a sports team. If the wheel spins in a predictable fashion, internet bandwidth could be saved by describing the movement of the wheel as "spinning as expected", where matching prediction software on the server and client sides both recognize that that part of the screen is taken up by an object in 10-frame loop.
This is different from encoding only the pixels that change from frame to frame. This prediction would incorporate likely changes in a picture based on simple movement patterns or on repetitive animations.
Consider a streaming game of hearthstone, like the last time I pretended to know about video encoding. There are certain animations that regularly impact video quality, such as sand sweeping across the entire screen, that involve a many pixels changing for a non-trivial amount of time. The video encoder does fine when the picture is mostly the same from frame to frame, but introduce one of these effects that causes a lot of pixels change at once, and the quality of the live stream.

However, the sand effect is one of sand moving slowly across the screen, its movement is predictable in that any one pixel of the effect is likely to follow the same trajectory as it did in the last few frames. Predictive video encoding is more scalable than the application specific encoding I mentioned before, but with time it could achieve the same effect if it was able to recognize frequently used pre-rendered effects such as lightning all over the screen. A predictive video encoder could recognize the first few frames of the 'lightning storm' effect and predict the rest without having to send any information about that part of the screen.

I'm no expert on video encoding, so this may all be jibberish.
Previous post on video encoding in Twitch, the possibility of application specific codecs.
Subscribe to:
Posts (Atom)