Motivation for reading / Who should read this:
I read Validity and Validation – Understanding Statistics, by Catherine S. Taylor in part as a follow up to the meta-analysis book from two weeks ago, and in part because I wanted to know more about the process of validating a scale made from a series of questions (e.g. The Beck Depression Inventory, or a questionnaire about learning preferences). For scale validation, there’s a field called Item Response Theory, which I understand better because of this book, but not at any depth.
This book, a quick read at 200 small pages, compliments the handbook of educational research design that Greg Hum and I made. I plan to recommend it anyone new to conducting social science research because it provides a solid first look at the sort of issues that can prevent justifiable inferences (called “threats to internal validity”), and those that can limit the scope of the results (called “threats to external validity”).
A good pairing with “Validity and Validation” is “How to Ask Survey Questions” by Ardene Fink. My findings from that book are in this post from last year. If I were to give reading homework to consulting clients, I would frequently assign both of these books.
What I learned:
Some new vocabulary and keywords.
For investigating causality, there is a qualitative analogue to directed acyclic graphs (DAGs), called ‘nomological networks’. Nomological networks are graphs describing factors, directly or not, that contribute to a construct. A construct is like a qualitative analogue of a response variable, but has a more inclusive definition.
To paraphrase of Chapter 1 of [1], beyond statistical checks that scores from a questionnaire or test accurately measure a construct, it’s still necessary to ensure the relevance and utility of that construct.
Hierarchical linear models (HLMs) resemble random effect models, or a model that uses Bayesian hyperpriors. An HLM is a linear model where the regression coefficients are themselves response values to their own linear models, possibly with random effects. More than two layers are possible, in which the coefficients in each of those models could also be responses to their own models, hence the term ‘hierarchical’.
What is Item Response Theory?
Item response theory (IRT) is set of methods that puts both questions/items and respondents/examinees in the same or related parameter spaces.
The simplest model is a 1-Parameter IRT model, also called a Rasch model. A Rasch model assigns a ‘difficulty’ or ‘location’ for an item based on how many respondents give a correct/high answer or an incorrect/low answer. At the same time, respondents also have a location value based on the items they give a correct/high response. An item that few people get correct will have a high location value, and a person that gets many items correct will have a high location value.
A 2-parameter model includes a dimension for ‘discrimination’. Items with higher discrimination will elicit a greater difference in responses between respondents with a lower and those with a higher location than the item. Models with more parameters and ones for non-binary questions also exist.
The WINSTEPS software package for item response theory (IRT):
WINSTEPS is a program that, when used on a data set of n cases giving numerical responses each of to p items, gives an assessment of how well each item fits in with the rest of the questionnaire. It gives two statistics: INFIT and OUTFIT. OUTFIT is like a goodness-of-fit measure for extreme respondents at the tail-ends of dataset. INFIT is a goodness-of-fit measure for typical respondents.
In the language of IRT, this means INFIT is sensitive to odd patterns from respondents whose locations are near that of the item, and OUTFIT is sensitive to odd patterns from respondents with locations far from the item. Here is a page with the computations behind each statistic.
On CRAN there is a package called Rwinsteps, which allows you to call functions in the WINSTEPS program inside R. There are many item response theory packages in R, but the more general ones appear to be “cacIRT”, “classify”, “emIRT”, “irtoys”, “irtProb”, “lordif”, “mcIRT”, “mirt”, “MLCIRTwithin”, “pcIRT”, and “sirt”.
For future reference.
Page 11 has a list of common threats to internal validity.
Pages 91-95 have a table of possible validity claims (e.g. “Scores can be used to make inferences”), which are broken down into specific arguments (e.g. “Scoring rules are applied consistently”), which in turn are broken down into tests of that argument (e.g. “Check conversion of ratings to score”).
Pages 158-160 have a table of guidelines for making surveys translatable between cultures. These are taken from a document of guidelines of translating and adapting tests between languages and cultures from the International Test Commission. https://www.intestcom.org/files/guideline_test_adaptation.pdf
The last chapter is entirely suggestions for future reading. The following references stood out:
[1] (Book) Educational Measurement, 4th edition, by Brennan 2006. Especially the first chapter, by Messick
[2] (Book) Hierarchical Linear Models: Applications and Data Analysis by Ravdenbush and Bryk 2002.
[3] (Book) Structural Equation Modelling with EQS by Byrne 2006. (EQS is a software package)
[4] (Book) Fundamentals of Item Response Theory, by Hambleton, Swaminthan, and Rogers 1991.
[5] (Book) Experimental and Quasi-Experimental Designs for General Causal Interance by Shadish, Cook, and Campbell 2002. (this is probably different from the ANOVA/Factorial heavy Design/Analysis of Experiments taught in undergrad stats)
[6] (Journal) New Directions in Evaluation
Sunday, 29 November 2015
Tuesday, 10 November 2015
I read this: Meta-Analysis, A Comparison of Approaches
My motivation for reading Meta-Analysis: A Comparison of Approaches by Ralph Schulze was to further explore the idea of a journal of replication and verification. Meta-analyses seemed like a close analogy, except that researchers are evaluating many studies together, rather than one in detail. I’m not working on any meta-analyses right now, but I may later. If you are reading this to decide if this book is right for you, consider that your motivations will differ.
Saturday, 31 October 2015
A Web Crawler using R
This R-based web crawler, available here...
1. Reads the HTML of a webpage from a given address,
2. Extracts the hyperlinks from that page to other pages and files,
3. Filters out links that fail to meet given criteria (e.g. other websites, already explored, and non-html)
4. Stores the origin and destinations of the remaining links,
5. Selects a link from those discovered so far, and returns to 1.
The scraper can be used to gather raw data from thousands of pages from a website, and reveal information of the network of links between them. For example, starting just now at the front page of the National Post website, the crawler visited a news article, the main page for horoscopes, the day's horoscopes, and an article from the financial pages of the paper.
Wednesday, 28 October 2015
Take-home lessons and code from a factor-cluster analysis with imputation
Recently I was tapped to examine data from a survey of ~200 children to find if their learning preferences fell into well-defined profiles (i.e. clusters). The relevant part of the survey had more than 50 Likert scale questions The client and I had decided that a factor analysis, followed by a cluster analysis would be most appropriate.
I learned some things in doing this analysis, and wanted to share that and some relevant code.
Sunday, 18 October 2015
Teaching Philosophy Statement on Intro Math/Stats - Cartographers of Knowledge
In the digital age, a teacher's role is not simply to present knowledge, but to navigate it. The overwhelming majority of the information that an undergraduate gains in her degree is available for free on the internet or in libraries.
A digital age instructor's job is to guide and motivate students' paths through this information – to provide the vision and context necessary to develop expertise in a field. Introductory courses make up the bulk of students' collective experience with mathematics and statistics, so any expertise to be gained in those one or two courses needs to be a self-contained package.
For example, rigorous proofs serve introductory students very little; the practice of rigor and constructing proofs has little value until upper-division courses. Introductory students learn by doing the tasks that are actually relevant to the course: examples. As such, I prefer to relegate much of the proof work to optional out-of-class readings. The extra instructional time for guided, step-by-step examples makes the material more accessible. It also provides more opportunities to fill the fundamental gaps from high school mathematics that will otherwise prevent understanding. For the few that do continue in a mathematics or statistics major, I feel that what they may lack in experience with proofs is more than compensated by a stronger foundation in the introductory material.
This focus on accessibility extends to my policies on assignments and office hours. Assignments should be vehicles for students to struggle through a set of practice problems and receive formative feedback. However, logistics of providing quality feedback aside, that doesn't work for everyone. Assignments need to have grades attached so students will have extrinsic motivation to completing them, but these same grades penalize mistakes on something that should be practice.
I want assignments to be important and challenging enough to take seriously, but not so much as to tempt plagiarism. In the past, I have solved this by booking extra office hours on the days before assignments are due, and telling my students that I will give them entire solutions to assignment questions. I've found that on these office days, a group of 5-12 students would come to my office with their assignment hang-ups, but that they could answer each others' questions with only moderate guidance from me. Some of these students likely sat in to get their solutions from the rest of the office group, but that's still better than copying written assignments verbatim.
Finally, I try to explicitly declare the 'take-home messages' by including them in my lessons. That is, the few ideas that I hope students will remember long after the final exam is over. These messages include general strategies about the mathematical sciences such as “every hard problem is merely a collection of easy problems”, and George Box's quote “all models are wrong, some are useful.”. If my students are to retain anything from their time spent on coursework, I hope it's something of value and general applicability rather than memories of referring to tables of integrals and probability.
Monday, 12 October 2015
Now you're thinking with gates!
What do Nintendo and Bitcoin enthusiasts have in common? They weren't content with solving their problems through software advancements alone. The statistical computing field shouldn't be either.
-------------------
The Super Nintendo Entertainment System is a cartridge-based system, meaning that its games were stored on circuit boards encased in plastic cartridges. Unlike disc-based media of most later generations of game consoles, the contents of cartridges were not restricted to read-only data. The most common addition to game cartridges was a small cache of re-writable memory used to store progress data in the cartridge.
Originally, active objects in games, called sprites, could only be displayed as one of a set of pre-drawn frames. That's why sprite animations are usually simple loops of a few frames, and why characters are rarely seen changing size as they move towards or away from the player's point of view.
However, later games also included special-purpose microchips that expanded the graphical capabilities of the Super Nintendo console itself. One of these chips allowed the SNES to change the way sprites look as the game was happening, which made sprites look much more alive. This chip also allowed for rudimentary three-dimensional rendering.
Any software workaround to get these effects using only the hardware given in the Super Nintendo would have taking much longer and produced much worse results, if any at all. The video on the Super Nintendo (SNES) by video game trivia group Did You Know Gaming covers these effects and the chips in more detail, and shows some great demonstrations.
------------------
Bitcoin, is a cryptocurrency. Part of what gives it value is the premise that it is computationally hard to create or 'mine' for new ones. In fact, there is a self-adjustment mechanism that increases the mining difficulty in proportion to the total computing power of all miners.
I've appended this historical chart of the log of the total computer power (and the log difficulty), over time with the two hardware advancements that defined the trend in bitcoin mining power.
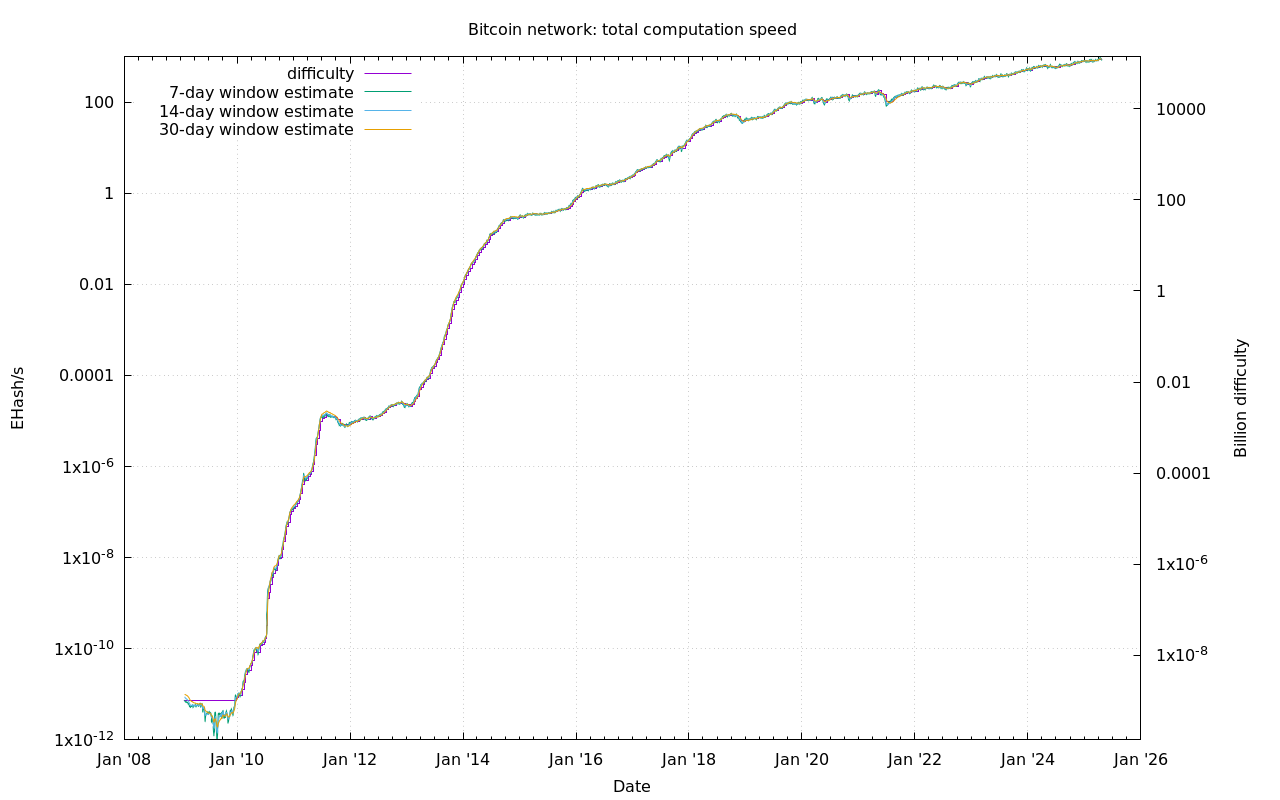

The first event represents the first time mining using a more specialized graphical processing unit (GPU) rather than a more general central processing unit (CPU) was made publicly possible. Since many miners had compatible graphics cards already, we see a tenfold jump in power almost instantly.
The second event represents the first time mining using a single-purpose processor, called an ASIC* was introduced to the market. This time, another rapid increase in processing power is sparked, but without the initial leap.
An ASIC is orders of magnitude faster at the simple, repetitive task of mining bitcoins than a GPU is, and a GPU mines orders of magnitude faster than a comparably priced CPU. In both cases, the new hardware quickly rendered any previous mining methods obsolete.
* Application Specific Integrated Circuit.
---------------
When developing new methods to solve computational problems, a software approach usually works best. The results of purely software-based are often portable as packaged programs, and the dissemination of improvements can be as quick and as cheap as a software update. The feedback loop of testing and improvement is very quick, and there are many languages such as the R, SAS, and Julia that can make software-based solutions a routine task.
Making hardware to solve a problem may sound insane by comparison - why would anyone willingly give up all of those advantages? This is where Field Programmable Gate Arrays come in. An FPGA is essentially a circuit board that can be programmed down to the gate level. That is, a user can write a program in terms of the fundamental particles of computation, OR, NOT, XOR, AND, and NAND gates.
The FPGA takes a set of gate instructions and physically wires itself into the programmed configuration. When set, the FPGA is essentially an ASIC, an processor that can only do one task but potentially much faster than a general purpose computer. However, if needed, an FPGA can be re-programmed, so the advantage of a quick trial-and-error turnaround is there. Also, the program can be disseminated like any other software. The most popular FPGAs cost between $200 and $500 USD.
The bitcoin ASIC started off as an FPGA. Once the FPGA program was made, it took about a year for the first ASICs to be sold. This is encouraging for anyone looking towards FPGAs for the next great leap in statistical computing, as it means the endeavor has commercial viability. Just think how much faster some common methods could become even if only large matrix inversion was made faster.
It's time to start thinking with gates.
Tuesday, 8 September 2015
Arguments for Journals of Replication
In today's xkcd, a collection of hypothetical headlines are given, all of which would spell trouble for science as a whole. Also, these headlines all have to do with replicating experiments. The only fictional part of (most of) these headlines is that they're showing up in the news, because this is an old problem. Given that new journals are frequently being made as fields evolve and grow, it's surprising to not find any journals of replication and verification, because having such journals could help make science more honest.
Creating and contributing to journals dedicated to replicating, verifying, and assessing work in a field is a worthwhile endeavour. Here's why:
Primary Motivation - Having a journal of replication in a field would implicitly improve the quality of research across that field. It would do this by effectively putting a bounty on bad research by offering a publication opportunity for addressing flaws. It also provides an incentive for a team that 'gets there second' to publish, which could remove some of the unscientific competitiveness of people working towards the same goal. Finally, it provides relatively easy publication opportunities for people wishing to do the work that makes a field's body of work more cohesive by repeating key experiments or by conducting meta-studies.
Assertion 1 - Replication has high scientific value: Consider an experiment done twice, in two independent labs. It may not produce as much new information as two different experiments, but the information it does provide would be of a higher quality. That's what scientific journals are supposed to do - focus on quality. Large volumes of low quality information can be found anywhere.
Assertion 2 - Replication is easy and safe: Assuming that the method have been outlined well, someone trying to replicate an experiment can skip past a lot of the planning and false starts of the original researcher. The second research team even has the first one to ask questions. It's safe in that the chance of a new discovery, and hence publication delays, is low. This makes it suitable for the sort of mass produced work that can be outsourced to graduate students with minimal degree hiccups.
Assertion 3 - A replication journal has reward potential for contributors: Logically, most replication papers fall into two categories: Refutation or verification. If research is verified, the original researchers gain prestige and a citation, and the replicators gain a publication. In future work, many groups mentioning the original work will want to cite both papers because together they make a stronger argument. If the research if refuted, at best it could spark interest in 'tiebreaker' work by a 3rd research party, which would cite both (positively, if everything was done honestly), and at worst the original work dies early where it would or should have anyway, and the replicators establish their reputation for rigor.
Assertion 4 - A replication journal has reader appeal: If someone is reading a research paper, they may be interested how credible the work is after it has been subject to public scrutiny. A replication journal appropriate to the paper's field would be a good first place to look because it would save the reader the trouble of filtering through work that cited the paper in question or looking for otherwise related work that may lend to or take credence from the paper. In short, a replication journal would offer the same service to readers that review sites offer to consumers of more commercial goods.
Assertion 5 - A replication journal would be easy to administer: Aside from papers on related verification methods, all the relevant submissions to such a journal would be adhere to specific formulae - they would either be direct replications or metastudies. Hopefully, this would make the editing and review work of these papers easier because most viable papers would look the same: Introduction of the work to be replicated, comparison of methods, comparison of results, short discussion. Criteria for publication would have few ambiguities that require editorial decision-making.
Tuesday, 4 August 2015
Lesson Prototype - First Lecture on Multiple Imputation
Continuing the work on my data management course, here's the start of the Imputation unit. I'm intending three units in total - Text processing, principles of data manipulation (cleaning, merging, formatting, and database access), and imputation.
Friday, 31 July 2015
Possible Application of Approximate Bayesian Computation for Networks
I've been thinking about possible applications for the network simulation/analysis program that Steve Thompson and I developed as part of my PhD thesis.*
I propose to investigate the effect of response order/timing in respondent-driven sampling on estimates of network parameters.
Here I'm assuming that samples are taken in waves. That is, a collection of seed members of the population are identified and given the initial coupons. If the standard deviation of the response times is small compared to the mean, the network of the population is being sampled in a manner similar to breadth first search (BFS). If the standard deviation of response times is large relative the mean, the network ends up being sampled in a manner closer to that of a depth first search (DFS). Each of these sampling methods has the potential to provide vastly different information about the sample.
Such an investigation would include four parts:
1) Motivating questions: Why would we care about the time it takes members of the population to be entered into the sample? Because perhaps these times could be influenced by different incentive structures. If they can, what is best? If they cannot, we can do a what-if analysis to explore counter-factuals. Does timing matter? What sampling and incentive setups are robust to the effects of response times? Are there statistical methods that can adjust for the effects of response times?
2) Find some real respondent-driven samples, preferably by looking in the literature of PLoS-One and using the data that is included with publications, but possibly by asking other researchers individually.
Look at the time stamp of each observation in each data set, if available, and fit a distribution such as gamma(r, beta) to the time delay between giving a recruitment coupon and that recruitment coupon being used. Compare the parameter estimates that each data set produces to see if there is a significant difference between them and see if there's any obvious reason or pattern behind the changes.
3) Generate a few networked populations and sample from each one many times using the different response-delay time distributions found in Part 2. Are there any significant changes to the network statistics that we can compute from the samples we find? That is, how does the variation of the statistics between resamples under one delay time distribution compare to the variation between delay time distributions?
4) Employ the full ABCN system to get estimates of whatever network parameters we can get for case ij, 1 <= i,j <= M, where M is the number of datasets we find. Case ij would be using the observed sample from the ith dataset, with simulations in the ABCN system using the delay distribution estimated from the jth dataset.
This way, we could compare the variation in the network parameters attributable to the sample that was actually found, and how much was attributable to the difference in time it took for recruitments to be entered into the survey. Also, we effectively will have performed a what-if analysis on the datasets we use - and seeing if the conclusions from the datasets would have been different if the recruited respondents had been responded with different delay structures.
---------------------------------------
*This network simulation/analysis system takes an observed sample of network and computes a battery of summarizing statistics of the sample. Then it simulates and samples from many networks and computes the same battery from each sample. It estimates the parameters of the original sample by looking at the distribution of parameters from the simulation samples that were found to be similar to the observed sample.
This will all be explained again, and in greater detail when I post my thesis after the defense in... gosh.. a month. Basically it's statistical inference turned upside down, where you generate the parameters and see if they make the sample you want, instead of starting with the sample and estimating a parameter value or distribution. The base method is called Approximate Bayesian Computation.
Sunday, 26 July 2015
Prediction Assisted Streaming
The online game path of exile has a trick for reconciling a game that requires quick reaction times with the limitations of servers: it predicts the actions of the players. It doesn't have to predict far ahead - a couple hundred milliseconds - to keep the action running smoothly most of the time.
Prediction on this time frame isn't hard in principle; play often involves performing the same short
action repeatedly, such as firing an arrow, so the default prediction is just more of that. When the server predicts incorrectly, it usually has enough time to 'rewind' to the present and handle things as they come. The prediction is just an extra buffering layer that's in place when there is a lot of server lag.
Does video or music streaming do this? Could it?
In a song with a repetitive baseline, could the information to the client computer include: "repeat the sound from time x with the following deviations included in the buffer", rather than "play the following sound"? The "sound at time x" in this case is a note from the baseline and the deviations being the result of a human playing an instrument and not hitting the note exactly the same every time. In a case like that, potentially less data would need to be sent to reproduce the song, allowing for longer buffers or higher sound quality.
Likewise for video. Consider a live video feed of a soccer match, in which a player is running across the field. Video prediction may determine there is an object moving at some speed in some direction and predict a few frames ahead where that object will be, and thus what pixels to draw in that spot. Then the streaming service, making the same prediction, could just send the video information that deviates from this prediction.
For repetitive patterns like an animation of a like a spinning wheel or sparkling logo of a sports team. If the wheel spins in a predictable fashion, internet bandwidth could be saved by describing the movement of the wheel as "spinning as expected", where matching prediction software on the server and client sides both recognize that that part of the screen is taken up by an object in 10-frame loop.
This is different from encoding only the pixels that change from frame to frame. This prediction would incorporate likely changes in a picture based on simple movement patterns or on repetitive animations.
Consider a streaming game of hearthstone, like the last time I pretended to know about video encoding. There are certain animations that regularly impact video quality, such as sand sweeping across the entire screen, that involve a many pixels changing for a non-trivial amount of time. The video encoder does fine when the picture is mostly the same from frame to frame, but introduce one of these effects that causes a lot of pixels change at once, and the quality of the live stream.
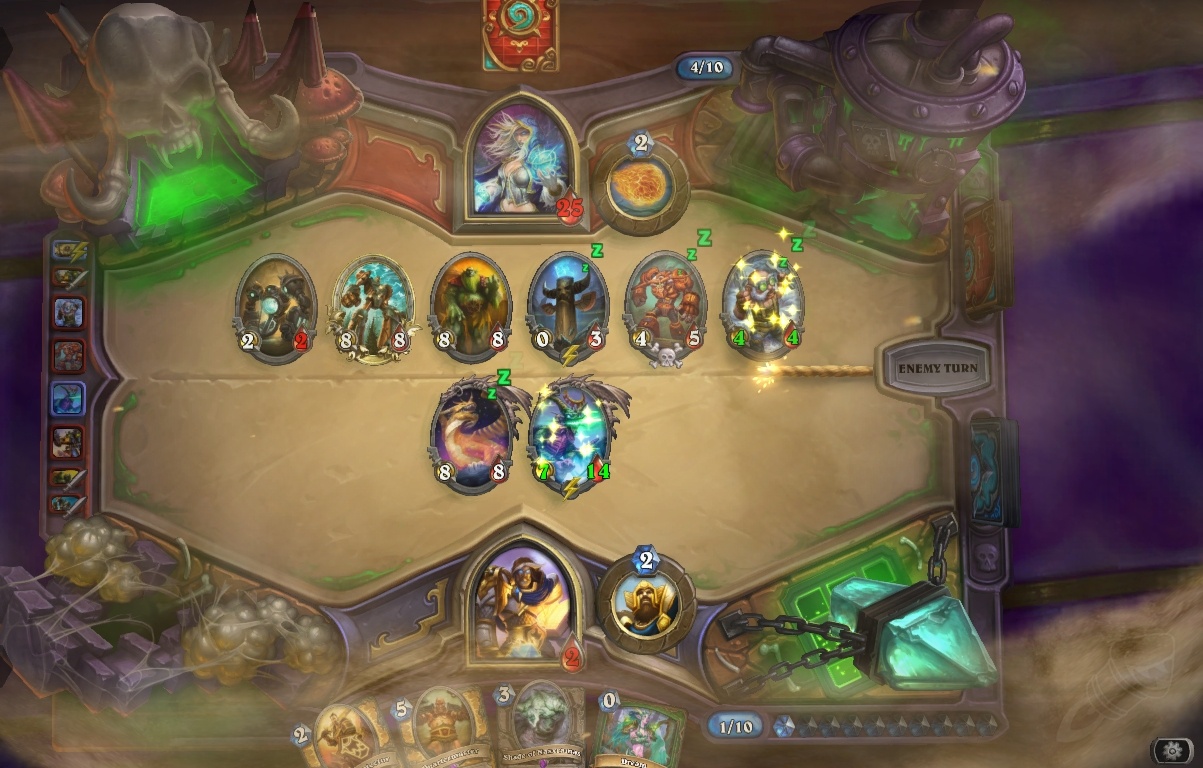
However, the sand effect is one of sand moving slowly across the screen, its movement is predictable in that any one pixel of the effect is likely to follow the same trajectory as it did in the last few frames. Predictive video encoding is more scalable than the application specific encoding I mentioned before, but with time it could achieve the same effect if it was able to recognize frequently used pre-rendered effects such as lightning all over the screen. A predictive video encoder could recognize the first few frames of the 'lightning storm' effect and predict the rest without having to send any information about that part of the screen.
I'm no expert on video encoding, so this may all be jibberish.
Previous post on video encoding in Twitch, the possibility of application specific codecs.
Sunday, 19 July 2015
Using optim() to get 'quick and dirty' solutions, a case study on network graphs
The optim() function in base R, is a generalized optimizer for continuous functions. It looks for the minimum of some objective function that you define across some continuous parameter space that you define.
In this post, I show how to use optim() to find a (inelegant, but workable) solution to do something very complex, plot a network of nodes based on the shortest path between them, with relatively little programming effort.
In this post, I show how to use optim() to find a (inelegant, but workable) solution to do something very complex, plot a network of nodes based on the shortest path between them, with relatively little programming effort.
Saturday, 11 July 2015
Danni and Jeremy's Wedding Speech
As requested, here is the speech that was given for Danni-Lynn Laidlaw and Jeremy Strang's wedding last month.
[Party 1] was Danni-Lynn
[Party 2] was Jeremy
[Member of Audience] was Calen, Danni's brother.
Regular text represents my own additions
Italic text is taken verbatim from the Government of British Columbia's standard ceremony,
of which the bold italic parts are immutable and cannot be changed.
Anything in underline is spoken by one of the two parties being married.
The standard ceremony can be found at http://www2.gov.bc.ca/assets/gov/residents/vital-statistics/marriages/vsa718.pdf
-----------------------------------------------
Majestic Ladies, Handsome Gentlemen, and [Member of Audience].
We have assembled here to acknowledge a force that ruthlessly devoured billions before and will no doubt continue to consume live in their prime until the sky crumbles.
This remorseless and unceasing force is called love. These two, though their forms appear before you, are hopelessly lost -- beyond mourning , really.
Today we witness the passing of [Party 1] and [Party 2] into the penultumate stage of their falling to this force. The true word for this stage makes all who hear it cry blood and vomit leeches. Thankfully I lack the four tongues required to pronounce it. However, even the English word has terrified lesser men before. That word is "marriage".
The state of matrimony, as understood by us, is a state ennobled and enriched by a long and honourable tradition of devotion, set in the basis of the law of the land, assuring each participant an equality before the law, and supporting the common right of each party to the marriage.
There is assumed to be a desire for life-long companionship, and a generous sharing of the help and comfort that a couple ought to have from each other, through whatever circimstances of sickness or health, joy or sorrow, proserity or adversity, the lives of these parties may experience.
Marriage is therefore not to be entered upon thoughtlessly or irresponsibly, but with a due and serious understanding and appreciation of the ends for which it is undertaken, and of the material, intellectual, and emotional factors which will govern its fullfillment.
It is by its nature a state of giving rather than taking, of offering rather than receiving, for marriage requires the giving of one's self to support the marriage and the marriage and the home in which it may flourish.
It is into this high and serious state that these two persons desire to unite.
Therefore:
I charge and require of you both in the presence of these witnesses, that if either of you know of any legal impediment to this marriage, you do now reveal the same.
Let [Party 1] repeat after me:
"I solemnly declare that I do not know of any lawful impediment why I, [Person 1] may not be joined in matrimony to [Person 2]."
Let [Party 2] repeat after me:
"I solemnly declare that I do not know of any lawful impediment why I, [Person 2] may not be joined in matrimony to [Person 1]."
There having been no reason given why this couple may not be married, nor any reasonless jibbering that could be interpreted as such, I ask you to give answer to these questions.
Do you [Party 1] undertake to afford to [Party 2] the love of your person, the comfort of your companionship,m and the patience of your understanding, to respect the dignity of their person, their own inalienable personal rights, and to recognize the right of counsel and the consultation upon all matters relating to the present, future, and alternate realities of the household established by this marriage?
(A prompt of 'do you, or do you not' may help here)
[Party 1]: I do.
Do you [Party 2] undertake to afford to [Party 1] the love of your person, the comfort of your companionship,m and the patience of your understanding, to respect the dignity of their person, their own inalienable personal rights, and to recognize the right of counsel and the consultation upon all matters relating to the present, future, and alternate realities of the household established by this marriage?
(Again, a prompt of 'do you, or do you not' may help here. Especially because doing it twice makes it sound planned)
[Party 2]: I do.
Let the couple join their right hands, claws, tentacles, feelers, probosci, or pseudopods, and let [Party 1] repeat after me.
I call on those present to witness that I, [Party 1], take [Party 2] to be my lawful wedded (wife/husband/spouse), to have and hold, from this day forward, in madness and in health, in whatever circumstances life may hold for us.
and let [Party 1] repeat after me.
I call on those present to witness that I, [Party 1], take [Party 2] to be my lawful wedded (wife/husband/spouse), to have and hold, from this day forward, in madness and in health, in whatever circumstances life may hold for us.
Inasmuch as you have made this declaration of your vows concerning one another, and have set these rings before me, I ask that now these rings be used and regarded as a seal and a confirmation and acceptance of the vows you have made.
Let [Party 1] place the ring on the third noodly appendage of [Party 2]'s left hand, repeat after me:
With this ring, as the token and pledge of the vow and covenant of my word, I call upon those persons present, and those unpersons lurking among us beyond mortal sight, that I, [Party 1], do take thee [Party 2], to be my lawful wedded (wife/husband/spouse)
Let [Party 2] say after me:
In receiving this ring, being the token and pledge of the covenant of your word, I call upon those persons present to witness that I [Party 2] do take thee [Party 1] to be my lawful wedded (wife/husband/spouse).
Let [Party 2] place the ring on the third noodly appendage of [Party 1]'s left hand, repeat after me:
With this ring, as the token and pledge of the vow and covenant of my word, I call upon those persons present, and those unpersons lurking among us beyond mortal sight, that I, [Party 2], do take thee [Party 1], to be my lawful wedded (wife/husband/spouse)
Let [Party 1] say after me:
In receiving this ring, being the token and pledge of the covenant of your word, I call upon those persons present to witness that I [Party 1] do take thee [Party 2] to be my lawful wedded (wife/husband/spouse).
And now, forasmuch as you [Party 1] and [Party 2] have consented to legal wedlock, and have declared your solemn intention in this company, before these witnesses, and in my presence, and have exchanged these rings as the pledge of your vows to each other, now upon the authority vested in me by the province of British Columbia, I pronounce you as duly married.
You may kiss.
Sunday, 31 May 2015
First thoughts on narrative reporting
I just finished reading The Mayor of Aihara, a biography of a man named Aizawa from rural Japan derived from 1885-1925 of his daily journal. It was the first history book I've read in six years.
I read it because I wanted to get a sense of how non-fiction is written outside of the sciences. The content was good, but it was the style I was looking for, which turned out to be a 160 pages of narrative sandwiched between two 20-page blocks of analysis and commentary.
The introductory chapter discusses the limitations of the biography as a view into the life of the Japanese as a whole. It also gives some general context of the world that Aizawa lived in.
The next five chapters cover blocks of Aizawa's life. Events within each chapter are told mostly in chronological order. There is some jumping around to help organize the material into something like story arcs, except that it's almost all about one person.
In other places, details that the biography author couldn't possibly have known are included, such as the details of Aizawa's birth, and the reasoning behind the local police officer having a bicycle.
Sometimes the author's interpretations are injected, such as that Aizawa was mostly unaware of the plight of the tenant farmers in his village, and that he cared more about his family than was typical. (In the conclusion chapter, some of these assumptions are justified.)
These aspects gave the biography more cohesion as a story, with clearer connections between cause and effect, than Aizawa's life likely had in reality. I didn't mind much because it made the material easier to read, track, and remember.
Still, the reporting is subjective, not just where necessary, but also where the author could improve the work's narrative quality without sacrificing much accuracy. Contrast that to scientific reporting : when doing a chemistry experiment properly, every scientist should produce identical lab notes and the resultant reports should provide the same information regardless of who produced them. If someone else were to examine Aizawa's journal, even if they had the same background in Japanese history as the biography author, they would produce a biography with different information.
This focus on narrative in providing facts is perplexing but the rationale is visible.
Friday, 8 May 2015
The end of jobs
A friend recently asked me if I foresee any chance of "jobs", or in his words "the economic trade of labour in return for payment" becoming so unsustainable that we as society would abandon it. My response is below.
-----------------
No.
The term "chance" implies that I'm not certain about the unsustainability.
There will NEVER be enough meaningful jobs for everyone. Unemployment is only in a 'healthy' range around 6-7% right now because of a system stretched to its utter limit to create jobs, often at the cost of getting meaningful work done.
First, self employment is counted as jobs in this statistic, as is part time work. So the proportion of people that trade their labour for payment likely a lot smaller than official surface figures.
There are also a large portion of jobs that simply shouldn't be.
- Literally pointless jobs like full-service gas pumps. Really gas stations could be fully automated and could behave like large vending machines.
- Parasitic jobs such as car salespeople, day traders and arbitrageurs. I separate these from pointless jobs because they do perform a service, but only because of legacy systems that mandate that these services are necessary.
- Fields where the output of the field is only loosely related to the number of people working in the field, such as marketing. From the perspective of companies, if half of all ads disappears, the only real effect would be for each remaining ad to be twice as effective. Likewise, the benefit to the consumer, knowledge of a product, would be just as large with perhaps only 10% of ads retained. In that sense, 90% of the work in advertising, from ad creation to posting billboards, is parasitic.
Then there are the jobs that won't be for much longer.
- Physical jobs that are due for automation, such as semi-truck driving.
- Small manufacturing jobs that can be simply replaced by on-demand 3D printing.
- Technical jobs that routinely get automated, like how much search engines have supplanted librarians.
- Many service jobs are a fixed portion of the population, such as teaching, haircutting, and child care. However, the population of countries in the developed world are either flat, declining, or dependant upon immigration to maintain the population increase that modern economics relies upon so dearly.
- Many resource-based jobs are at risk to better energy efficiency, better labour efficiency, and automated landfill harvesting and reclaimation. Even argiculture is being turned upside down by cultured meat. With it, there goes shipping.
Finally, the work that NEEDS to be done such as environmental restoration, medical services, and the development of space technology, simply doesn't work well under an exchange-for-payment system because economically 'rational' people and corporations either won't or can't pay for it.
I would refer you to the 20 minute video "Humans Need Not Apply" for a compelling argument about how this is inevitable. My best resources for universal basic income and on post-scarcity are the novels Accelerando and Red Mars touch on these topics.
Wednesday, 6 May 2015
Prelude to a FUSS
I apologize in advance if this one is incoherent, as most of it has come in fever dreams over the last couple days.
I want to make a FUSS. That is, a Formula-Unspecified System Solver.
Saturday, 18 April 2015
Using Sampling Order in Network Inference
In this previous post, I had talked about how the order of values were sampled, but I gave a pretty esoteric argument involving compression and loss of information in a sample of 8 values.
For my current thesis project, I'm developing an inference methodology for snowball samples. Snowball samples, or more generally respondent driven samples, are used to sample hard-to-reach populations or to explore network structure. The sampling protocol I'm working with is
For my current thesis project, I'm developing an inference methodology for snowball samples. Snowball samples, or more generally respondent driven samples, are used to sample hard-to-reach populations or to explore network structure. The sampling protocol I'm working with is
- Select someone to interview from the population by simple random sampling.
- In the interview, ask that person the number of connections they have (where the definition of a 'connection' is defined by the study; it could be business partners, sexual partners, close friends, or fellow injection drug users.)
- For each connection the interviewed person has, give that person a recruitment coupon to invite that connected person to come in for an interview, often with an incentive.
- If no connected person responds, go to Step 1 and repeat.
- If one connected person responds, go to Step 2 and repeat.
- If multiple people respond, go to Step 2 and interview each of them.
In reality, people are interviewed in the order they come in for an interview. In my simulation, people are interviewed in a breadth first search system, in which I assume connections to the first interviewed person are followed before any connections to those connections are followed. This may make a difference (which I will explore later), because of two limitations of the sample this protocol is modeled after:
- When the desired sample size has been attained, no more people are interviewed, even if additional people respond to the invitation. (Budget limitation)
- Connections that lead back to people already in the sample are ignored. Even the information about there being a connection is missing. (Confidentiality limitation)
The budget limitation implies that the interviewing order impacts the subjects that are included in the sample, which in turn affects any statistics measured, even those for which sampling order is ancillary.
The limitation on reported connections implies that the observed network structure is dependent upon the sampling order, even when controlling for the actual members of a sample. For example, if someone receives invitation coupons from multiple connections, they will only show up as directly connected to the first person whose coupon they use. The other connections may not even be observed to be the same network component, even though they must be by definition.
Furthermore, every sampled network will be a forest. That is, a collection of one or more trees - networks that have no cycles, connections 'back into themselves'. Only being able to observe these tree sub-networks of the actual network limits what inferences can be made about the network as a whole. Observed link density isn't very useful for well-connected graphs because the observed link density is maximal just shy of one link/node, in cases where the observed network is one huge component.
Alternate measures of density, like component diversity, ( the Shannon species diversity index, applied to the components that nodes are in), run into this problem as well. In Figure 1 below, component diversity is useless at estimating the average (responding) degree of the network for networks with more than 1.5 links/node.
 |
| Figure 1, a network measure based only on observed network structure. |
However, we can also estimate things like dPr(used)/dt, the rate of change in the proportion of a sample's connections that are also included in the sample over time. Barring variation due to response rate, we would consider such a measure to be non-positive.
For networks that are sparse in large populations, the rate of change should be near zero, because very few connections will lead back into nodes that were already explored. What few recruitments there are will be just as successful up until near the end of the sample when a few may be turned away.
However, for well-connected networks, sampling is done much more often by recruitment rather than by simple random sample. As more a component network is explored, the chance that each successive connection followed leading to someone already in the sample increases. Therefore, for well connected graphs, we would expect dPr(used)/dt to be distinctly negative.
As Figure 2 shows below, we can use the rate of change in successes to differentiate between populations up to 2.5 links/node, even though most of the networks that we observe from 1.5-2.5 links/node all show up as single large components. Also note how poorly dPr(used)/dt differentiates between networks in the region where the structure-based diversity index excels.
 |
| Figure 2, a network measure based on sampling order. |
Measures like these, in combination, can be used to make estimates of the features of the population as a whole, but that's for a poster I'm working in the coming weeks.
Monday, 13 April 2015
Temporary Blogging Slowdown, Future Plans
It was my original intention to publish four posts on this blog throughout each week. However, I am currently in the last few months of my PhD thesis in Statistics at Simon Fraser University.
Most of my writing effort is being funneled into that in the hopes of defending before the end of next semester. As such, any posts that appear here until the thesis is submitted will be less frequent and of lower effort, such as the laser tag ranking post instead of the goal difference average posts.
With luck, there will be a burst of high-quality material here in here in the late summer and fall to make up for the slack and bring the average back to 4+ good posts per month. I have a lot left to write about, including:
- Snowball sampling and the network analysis work I'm doing currently.
- Milaap, Kiva, Sunfunder, and lending for good and profit.
- Driving forces behind application specific integrated integrated circuits (ASICs), specifically Bitcoin and Super Nintendo.
- FPGAs , and a pipe dream to build an ASIC for large matrix operations.
- Dealing with scrap textiles, composting, crafting, and future industrial needs.
- Some arguments for landfills being the future of mining. Methane harvests, leachate harvests, necessary drilling advances, and the possible gamification of sorting trash.
- Mental health in academia, and mental health personally.
- Many more kudzu levels.
- Plans for a kudzu app, and a pipe dream of making it a carbon negative game through ad revenue and the European Carbon Exchange.
- An essay on how we all suffer from diversity defecits in heavily gendered fields, as written by a white, Anglophone, heterosexual, cis, middle class man from a nuclear family in the suburbs. (Not a satire, despite the title)
- ongoing development of a senior undergrad course on data formatting and management,
- more R package spotlights, with priority on mice for multiple imputation, and on gologit for modelling ordinal data.
- ongoing development of the R packette for sums of variables.
- ongoing development of an R packette on "debinning", and the methodology surrounding the partial recovery of within-bin data from binned data and covariate information.
- A 'to do' list for humanity, and preparation for a world of automation.
- A commentary on the energy transistion, peak child, and how the tar sands, arctic drilling, and shale fields cannot possibly be profitable in the long term.
Sunday, 29 March 2015
Laser Tag Rating System
This is a rough outline of an idea that Phil Ophus and I had. We want a rating system for laser tag. We want it to be a cumulative reflection of a player's skill over multiple games. We want a means to compare the laser tag skill of players that have a substantial play record, but not necessarily against each other in the same match. In short, we want an Elo or Trueskill style metric that is a shorthand for "this player is X skilled at laser tag".
However, laser tag has less standardization than the sports and games that these metrics are usually applied to.
As it is now, the single game score cards don't give any context of a skill outside of the single match displayed. Scores in general are higher in matches with many players and longer 'ironman' matches. A score of 50000 can demonstrate just as much achievement as a score of 100000 against equally skilled opponents by these factors alone.
There are strategy factors that affect score that don't fairly reflect skill such as picking mostly weak targets, and aggressive running around play rather than base protection. Besides within-game luck, other random noise is added in from equipment effects; some guns are in better shape than others.
Scores are naturally different between free for all and team games, and some players do better in different formats. However, it's reasonable to assume a strong enough association between the skill levels of a given player across formats that one format can inform the other.
All of this variation, and this is only from a single location: Planet Lazer near Braid Station, New Westminster. At this location, the scoring system rewards hitting much more than it penalizes being hit. Also, every target on a vest is worth the same amount, although this isn't necessarily true at other locations.
We want a ratings method that can be used to compare players in different arenas that may be using different rules. Ideally something anyone could see how well they stack up on a regional up to a worldwide level. However even if we only use places that use comparable equipment, the arenas are substantially different, whereas in many other sports the arena effect is negligible. The rules and scoring systems even differ from place to place.
Our intuition and short train ride's worth of literature searching suggest that no such system exists yet that can handle the non uniform, free for all situations of laser tag. I'm hoping that further developing the cricket similalulator to handle data of cricket players that are compete in multiple formats for multiple teams in a single year.
On the sampling design and logistics side, there are issues with data collection. What if a location's equipment doesn't record a key variable? How long is data retained? Are there enough return players? It seems like the next step is to draw up a research proposal, and bring it to planet Lazer and see if they would let us record their player data like that.
For after the thesis, if at all.
Sunday, 15 March 2015
R Packette - Weighted Binomial Sums
This R code file Weighted_BinSum.r is a... packette? Proto-package? Mini-package?
It's by no means a full R package because it doesn't have the proper documentation, but it's the start of what could be one.
It's by no means a full R package because it doesn't have the proper documentation, but it's the start of what could be one.
Tuesday, 10 March 2015
Improving the Exam Experience - A Research Proposal
I've read through quite a few reports on improvements in university learning in the last year. A few ideas have made quite an impression. Ideas like the flipped classroom paradigm, in which the lecture time is spent working through homework problems with the guidance of the instructor and peers, and instruction and note-taking happens before the class with the use of online videos.
However, I've only seen a few pieces on improving the exam experience. Students spend a lot of time thinking about their exam performance, but besides writing good questions (which is a difficult art in itself), not much thought on the instructor side seems to have gone into it.
However, I've only seen a few pieces on improving the exam experience. Students spend a lot of time thinking about their exam performance, but besides writing good questions (which is a difficult art in itself), not much thought on the instructor side seems to have gone into it.
Sunday, 8 March 2015
Kuzdu Update - Lock and Key
New Material:
First, there is a new dungeon available: Lock and Key, which features a pair of new spaces. Most of the map is sparse for treasure except for an optional room in the middle that become available about 2/3 through the map. I'm worried that on its own the treasure hoard is available too late to matter, but it could be just right for any meta-game rewards that are incorporated later.
The rules have been made more explicit in some cases, and the relic deck has been increased from 16 to 20 cards. The card "Drill Relic" has been replaced - see patch notes for details.

Other Links:
Patch Notes:
I've made some changes to Kudzu's presentation intended to make it scale up more smoothly.
- First, I've split off each dungeon into its own document. Each dungeon module includes the playable map for that level, a guiding layout, and an explanation of spaces found on that map. If there are any cards specifically for that map, they will be included.
- Generic Kudzu material such as rules and cards, however, are only found in a separate document. This way, updating the rules means changing one document instead of several. It also reduces legacy issues with players applying older rules to newer versions of the game.
- The card "Drill Relic" has been removed from the game for now. Having the ability to place tiles on walls is exciting, but has the potential to ruin any map where a major barrier is a single wall thick, as in Lock and Key. Cards with wall-breaking abilities will appear later, but attached to specific maps as starter cards.
Other thoughts and plans:
- The next module, Ulee's Pitfall, will not introduce new tiles, but will focus on more challenging uses for letter tiles. Players will start with a Pillar Relic, which allows them to turn letter tiles (and other tiles) into walls.
- Another possibility is 'portal' tiles that allow the player to start a crossword at one portal location and continue it at another. However, there may be memory issues with that. I want to experiment more with "Lock and Key" and tracking which keys have been collected before I try that.
- The logistics of a print-and-play game are more involved than I expected. Making things portable is taking more time than I expected, but hopefully the modularity changes will improve the development flow and allow more time for the creative aspects of the game.
- To my knowledge, nobody is testing the game at the moment, and neither am I. Most of my energy is going into thesis work at the moment, so playtesting and finding other playtesters is going to have to wait until the defense.
- I've been investigating the prospects of making Kudzu an Android game, again after the defense. I want to make the game a net good for the environment, and it seems like the best way to do that is by having a running advertisement bar on the bottom of the game, with a large portion of the revenue going towards either planting trees or buying up carbon permits and letting the permits expire unused. There are some other ideas involving in-game currency and 'cashing out', but the logistics of that are a distraction from game development at the moment.
Wednesday, 25 February 2015
New powerplay metrics applied to 2014-15 NHL teams
In this previous post I made a case for
a new powerplay metric called GDA-PK (Goal-Difference Average - Penalty Kill) that used the amount of time in a powerplay
state rather than the number of powerplay instances as its basis. My
argument was essentially that not every powerplay is the same: some
are majors, some are interrupted by goals or additional penalties,
and others are confounded by pulling the goalie and by shorthanded goals.
My aim was to present a new metric that would measure the effectiveness of special lineups in way that removed a lot of the noise and was easier to interpret in the context of the rest of the game.
GDA-PK represents the average goals gained or lost per hour when killing a penalty. In Table 1 below, for example, the Vancouver Canucks, have a GDA-PK this season of -3.87, so they fall behind by 3.87 goals for every 60 minutes in a 4-on-5 situation. This can also be written that the 'nucks lose a goal for every 60/3.87 = 15.5 minutes of penalty killing.
Likewise, GDA-PP represents the average goals gained or lost per hour of powerplay. Table 1 shows that the Detroit Red Wings manage to gain 8.00 goals for every 60 minutes of powerplay, or get ahead by 1 goal for every 7.5 minutes spent on the powerplay. This isn't the same as gaining 1 goal for every 7.5 minutes of penalty in favour of the Red Wings, because a lot of those penalties will be cut short by conversions.
Also note that it's 'Goal Difference', not goals scored/allowed. This way, both measures account for shorthanded goals by treating them as negative powerplay goals.
I wanted to see if there would be any major divergences between GDA measures and the traditional PP% and PK% (PowerPlay percent and Penalty Kill %) measures in terms of ranking the teams. Ideally, both measures would agree in rankings because they are intended to measure the same thing.
Results
Table 1: Powerplay and Penalty Kill
Goal Differential per Hour (Goals against minus goals for) and
related statistics for teams for the 901 of 1230 regular season games
up to 2015-02-24, inclusive.
|
League-wide GDA-PK: -5.163
League-wide GDA-PP: +5.163
Correlations between proposed and classic measures:
PP Pearson r = 0.892, Spearman's rho =
0.810
PK Pearson r = 0.833, Spearman's rho =
0.841
The league-wide GDA-PP and the GDA-PK balance out by definition.
Notable performances are highlighted in Table 1. The Carolina Hurricanes seem to get a lot more mileage out of their powerplays than their opponents (5.66 goals/hr gained vs. 3.26 goals/hr lost). Philadelphia and Washington are very exciting to watch during penalties in both directions.
After 60 games, each team has had 5-6 hours of powerplay time, and 5-6 hours of penalty kill time. As such, there's still a lot of uncertainty in the GDA-PK and PP of individual teams. Each team value should be considered to have a 'plus-or-minus 2 goals/hr' next to it. For example, Boston's GDA-PP of 5.00 could really mean they've been gaining 3 goals/hr on the powerplay and getting some lucky bounces, or that they should be gaining 7 goals/hr, but can't catch a break this season.
Further inference from these values is possible. We could make reasonable GDA-PK and PP estimates of specific matchups. For example, Pittsburgh's excellent penalty killing and Washington's excellent powerplay skills should cancel each other out. We would expect the Washington Capitals to gain (WSH PP + (- PIT PK) - LeagueAvg) = (7.76 + 3.56 - 5.163) = 6.16 goals/hr on the Penguins with a 1-man advantage.
We could also find the average length of a minor or major penalty, so we can use this to estimate how many goals a given penalty is worth, either league wide or for a given team. We can also find the success rate of penalty shots, assuming we can use the shootout to increase our sample size, so we could also find out how many penalty minutes a penalty shot is worth.
We could also find the average length of a minor or major penalty, so we can use this to estimate how many goals a given penalty is worth, either league wide or for a given team. We can also find the success rate of penalty shots, assuming we can use the shootout to increase our sample size, so we could also find out how many penalty minutes a penalty shot is worth.
The correlation measures Pearson's r
and Spearman's rho are positive and far from zero (they are on a
scale from -1 to 1). These correlations indicate a strong agreement
between the GDA measures and the traditional measures; a team that puts up good PP% / PK% numbers will put up comparably good GDA-PP/PK numbers.
Furthermore, we can use a similar metric to isolate even-strength situations and see how well a team fares when there are no penalties involved. In Table 2, GDA-EV (Goal Difference Average - EVen Strength) refers to the number of goals a team gains or loses on average per 60 minutes of even strength play. A positive number represents a team that outscores their opponents when there are no active penalties (or only offsetting ones), and a negative number represents a team that falls behind at even strength.
Table 2: Even-Strength Goal
differential per hour (Goals against minus goals for) and related
statistics for teams for the 901 of 1230 regular season games up to
2015-02-24, inclusive.
|
League-wide GDA-EV 0.000
Correlation between goal difference per game, and GDA-EV:
Pearson's r = 0.941 , Spearman's rho =
0.916
The league-wide GDA-EV is exactly 0, as expected. There is a very strong linear relationship between GDA-EV and simple goal differential, which may indicate that powerplay performance isn't as important as it's made out to be. Looking at all goals, the Buffalo Sabres seem to be uniquely awful, but when you remove the effect of penalties, they're merely as bad as Edmonton and Arizona.
Another note is that even though Montreal is currently the top of the Eastern Conference standings, they're only putting up half a goal more than their opponents on the 5-on-5 or the 4-on-4. They're on par with the L.A. Kings, who are currently on the playoff bubble.
Since teams spend the large majority of their time at even-strength, GDA-EV has a lot of data to draw from. You should consider them to be (plus-or-minus 0.5 goals/hr).
This is still very much a work in progress, and these measurements should be taken as preliminary only. There are likely still some bugs to work out that have gone unseen.
In this previous post, I gave a short demo of the nhlscrapr package, which allows anybody to download a play-by-play table of every hit, shot, faceoff, line change, penalty, and goal recorded. The data used to make Tables 1 and 2 come from nhlscrapr. Select details are found in the methodology below.
Methodology
I've written an R script, to count the time spent in each powerplay state and the number of events (in this case, events are goals) that occur in each state and for/against each team. A cautionary note to those trying to do similar things: the numbers in the home.skates and away.skaters variables are unreliable and you're better off tracking it yourself if it's critical. The other variables appeared to be pretty reliable, such as home and away goalie ID which made identifying empty-net times possible.
I apologize, but I won't be sharing the script to get this data, until I've considered (and possibly taken advantage of) the academic publication potential of the results in the tables below. Also, the script is a modification of one used for a research paper Dr. Paramjit Gill and I currently have in the submission stage, and I don't want to complicate that process.
Overtime and two-man advantage
situations was ignored. Neither the goals nor the time spent are
included here. However, the league-wide goal differential seems to be
in the 12-16 goals-per-hour range. There is nowhere near enough data
to say anything about individual teams in these situations.
The league-wide measures are not the
raw average of the values from each of the 30 teams because some
teams spend more time short handed or on the power play. Instead, they are computed by treating the whole league as a single team playing
against itself. If a team draws more penalties and spends more time on the powerplay, that team's performance will count for more towards the league-wide average than other teams. However, in reality, every team is contributing between 3.0% and 3.6% towards each league measure.
Any goals scored when the goalie was
on the bench for an extra skater (e.g. during a delayed penalty call
or when a team is losing at the very end of the game) were ignored.
This includes goals on empty nets, goals by teams with empty nets, and that time the Flames did both. The time where one (or both?) goalies were off
the ice was deducted from the appropriate situation. There was a mean
average of about 50 seconds of empty net per game, with a lot of
games with no empty net time.
Finally, only regulation play (the first 60 minutes of each game) is considered. This is to filter out any confounding issues such as teams scoring less often in overtime than they do in regulation.
Finally, only regulation play (the first 60 minutes of each game) is considered. This is to filter out any confounding issues such as teams scoring less often in overtime than they do in regulation.
Saturday, 14 February 2015
More examples of the Play to Donate model.
Tree Planet 3
This is the first in the Korean mobile game series that is available in English. Tree Planet 3 is a tower defense game where you defend a baby tree from waves of monsters and possessed livestock. You do this by recruiting stationary minions to beat down the monsters as they parade along the side of the path or paths to the tree. You also have a tree hero that has some movement and special abilities to slow or damage monsters.
Stages are a mobile friendly 3-5 minutes long, and finishing a set of three stages results in a real tree being planted (with proof of planting provided).
Part of the revenue for the game and the planting comes from the game's freemium pay-to-win model: beating a stage provides rewards to slowly unlock and upgrade new heroes, but rewards can be purchased for $USD right away. The rest comes from sponsorship from NGOs and from corporations that benefit from trees being planted, such as a paper company in Thailand that will buy back the trees later, and a solar power company in China that uses trees to catch dust that would otherwise blow onto their panels.
I greatly enjoy Tree Planet 3. For some stages I've managed to set up minions to win almost without looking, but for others I'm still working out a viable strategy. The monsters and maps are varied in function as well as look, which is better than I expect from most mobile games, let alone a charity one.
Aside from purchasing upgrades, play doesn't seem to have any effect on the revenue generated for the planting system, even though playing supposedly causes planting. Is the sponsorship paid on a per tree basis? I have questions, but the faq is in Korean only.
Aside from the sponsorship there were no advertisements such as a rolling banner; I would love to know how that affects a game like this.
---------------------
Play to Cure: Genes in Space
This game was commissioned as part of a 48 hour programming event by body called UK Cancer Research, if I'm recalling the details correctly.
In a stage of Genes in Space, the player plots a course through a map based on some genetic data that needs analysis. Then the player pilots their spacecraft in an over-the-view through the map with the genetic data showing, as well as the path they charted.
The goal of the player is to fly through as much of the genetic data as possible. The goal of the designer is to use multiple players charting and flying through the same map to find where the abrupt changes in genetic information occur, which will match with the points where an optimal player changes her flight path.
Aside from previously mentioned charity games, this one has the appeal that gameplay is actually creating value, rather than using your efforts to moving money from somewhere to somewhere nicer. By playing through a level, you are in fact contributing to science, and the rewards to upgrade your ship and climb a leaderboard are related to the density of the genetic data is that you manage to fly through (which in turn relates to quality of the contribution to analysis)
I enjoy the flavour of the game, and being able to paint my vessel to look like a bumblebee gummyship gathering genetic pollen.
However, the game was rushed and even after patches this is painfully obvious. It is unclear how ship upgrades help you, aside from the occasional meteor storm event that occurs after gathering, and which seems unnecessary and tedious.
The flight portion of the levels is extremely short: about 30 seconds to play, which follows 60 seconds to chart and 60-90 of loading screens and menus. By prolonging the flights by a factor of 2, I would be spend more time on the best part of the game and probably make better flight decisions, at the cost of processing maps 15-20% slower. Remove the meteor storm event and make ship upgrades aesthetic only, and even that loss is gone.
By far the worst problem is a bug where sometimes a blank map is presented, on which no route can be planned, and flight never ends. This could be because all the generic data has been analyzed, but I suspect it's an issue with corrupt genome data.
What elevates this from an annoyance to a deal breaker is the inability to do anything about it. There is no option to scrap the map and try a new one, and sometimes even uninstalling, then resetting the phone, then reinstalling fails to fix the issue.
If I'm right about the source, the problem could be cleared up by giving players more autonomy regarding their contributions. An option to manually download a new map, or several maps at once for offline play should be simple. It would also fix some of the loading issues and improve gameplay, especially if players could go through multiple genomes in one long flight.
One final note: I know finding these breakpoints in a genome is ineffective for a machine because I looked it up, but this player data should make for a fantastic training set.
Monday, 9 February 2015
R Package spotlight - quantreg
Linear regression and its extensions are great for cases when you wish to model the mean of values Y in response to some predictors X.
Sometimes, however, you may be interested in the median response, or something more general like the cutoff for the top 20 percent of the responses for a given set of predictors. To model such cutoffs, quantile regression excels, and the quantreg package makes it feel a lot like linear regression.
This spotlight includes a simple bivariate normal example, then moves on to a more complex applciation that could be used to track player progression in a video game (e.g. a future digitization of Kudzu).
Tuesday, 3 February 2015
Academic Salvage
One of my jobs is to facilitate research grants for educational development through the ISTLD (Institute for the Study of Teaching and Learning in the Disciplines) at Simon Fraser University. The Institute has given more than 130 awards to faculty-lead projects to improve the educational experiences of their classrooms. I've read the grant proposals and final reports of many of these awards and among the patterns that have emerged:
- Almost all the granted projects reach completion close their proposed timeline and submit a final report.
- Many of them mention plans to publish research papers in their proposals.
- Many of them have made measurable beneficial impacts on the experience of students, and these effects are publishable in education journals.
- Many of the final reports mention sharing the findings at on-campus talks and posters.
- Not as many project results actually get submitted to journals, even in response to a follow up a year after the final reports are submitted.
Papers are getting submitted, but not as many as there could be. Sure, there are some There's some barriers at the end of the projects to publishing. Part of the barrier is that the primary goal of the projects is to improve education, not to write about it. Still, it feels like a waste to finish research and write a report and a poster, but never get published credit for it.
I've been told by some colleagues that statistical analysis of the data at the end is often an issue, as well as the paper writing process. It makes me want to find projects that ended in this ABP (all-but-publication) state and offer to write and analyze in exchange for a name on the paper. From my perspective as a statistician and a writer, it seems like one of the most efficient ways to boost my own paper count. From the perspective of a faculty member who has completed such a project, I hope they would consider such an offer as a way to be first author of a real paper rather than sole author of an none.
Is there a name for someone makes these sort of arrangements? If not, I'd like to suggest 'academic salvager'? Specifically, I mean in someone who takes the raw materials from the unpublished research of others and value-adds it up to a paper.
Is there a lot of research in this all-but-publication state in other fields? This is just from one granting program, how much 'academic salvage' is out there waiting to be gathered, refined, and shipped out?
Subscribe to:
Posts (Atom)